Research Article | | Peer-Reviewed

Modelling Height-Diameter Relationship of Pinus Roxburghii in Nepal

Received: 30 July 2024     Accepted: 28 August 2024     Published: 20 September 2024
Views:       Downloads:
Abstract

Height and diameter are two factors that are considered when developing (volume and yield) tables, as well as for determining site quality and site index. Diameter is easily measured using precise and affordable instruments. However, height measurement is complex in terms of time, skill, and resource. So, developing allometric equation of height-diameter is useful to predict height from diameter to calculate tree volume, biomass, and carbon storage and survival analysis. The study was carried out in Nepal. The study area comprised of a total of 664 unique plots of Pinus roxburghii. Data was obtained from Forest Resource Assessment, 2018 undertaken by Forest Research and Training Centre (then Department of Forest Research and survey). Diameter was measured with a diameter tape at 1.3 m height above the ground level and total height was measured with a Vertex IV and Transponder. A two-phase cluster sampling was applied during data collection. Statistical software R and MS-Excel were used for data analysis. Correlation analysis showed significant positive correlation (r = 0.86) between DBH (diameter at breast height) and Height. The relationship between height as dependent variable to diameter was established through regression analysis, different suggested models were tested accordingly. Different forms of candidate models including linear, polynomial, logarithmic, and inverse were fitted to select the best height prediction model. The Akaike Information Criterion (AIC), Root Mean Square Error (RMSE), and Adjusted Coefficient of Determination (R2 adj.) were used to evaluate the model. Polynomial degree 2 form of equation (height=1.1052804+0.6252304*dbh−0.0021242*dbh2) resulted as the best model with values of adj. R2 RMSE, and AIC; 0.720, 3.639 and 2735.253 respectively.

Published in American Journal of Biological and Environmental Statistics (Volume 10, Issue 3)
DOI 10.11648/j.ajbes.20241003.12
Page(s) 49-59
Creative Commons

This is an Open Access article, distributed under the terms of the Creative Commons Attribution 4.0 International License (http://creativecommons.org/licenses/by/4.0/), which permits unrestricted use, distribution and reproduction in any medium or format, provided the original work is properly cited.

Copyright

Copyright © The Author(s), 2024. Published by Science Publishing Group

Keywords

Height, Diameter, Pinus roxburghii, Modeling, Height-Diameter Models

1. Introduction
The relationship between height and diameter of plants is of significant concern to agronomists, foresters, agro-foresters, ecologists, and ecosystem modelers for both practical and economic reasons. This relationship is particularly relevant for constructing mathematical representations for various applications . Tree height is a key metric used to quantify forest productivity and identify the productive capacity of specific sites . It is essential for both forest management and research activities. Diameter at breast height (dbh) and total height are commonly measured variables in forest inventories. However, unlike dbh, total height is less frequently used due to the higher cost and difficulty of accurate measurement . Therefore, predicting total height from dbh using reliable models is a practical solution.
Many studies have presented models for predicting the height-diameter relationship of tree stands, often using a representative sample of trees . In Nepal, the development of forest growth models is limited, leading to high uncertainty in growth and yield estimates. As a result, community forests apply conservative estimates of productivity, potentially leading to underutilization and reduced income for communities .
Chir pine (Pinus roxburghii) forests, found in the subtropical regions of Nepal at altitudes between 1000 and 2000 meters, comprise 7.05% of the country's total forest volume . The economic contribution of Chir pine forests to national and local development is substantial, making their management crucial. Species-specific models, such as height-diameter models, site index models, growth models, and biomass and volume models, are essential for scientific forest management. Height-diameter models can serve as sub-models in comprehensive models like biomass and growth and yield models .
Modeling the height-diameter relationship is complex due to variations in stand density, site quality, and other factors, which can even differ within the same stand . The relationship may also change over time . Therefore, more comprehensive models that include variables describing stand density and site quality are needed, though such models require significant resources . Despite the challenges, developing accurate height-diameter models is vital for forest management, carbon stock estimation, and understanding forest dynamics .
The climate of Nepal, a Himalayan country, is highly threatened by the impact of climate change, with atmospheric temperatures rising at a rate of 0.04 to 0.06°C per year, higher than the global average . Environmental changes, including rapidly warming temperatures and uncertain rainfall patterns, have widely affected forest ecosystems worldwide . These climatic factors influence the growth rate of forest trees, which is directly linked to forest economics and the ecosystem services provided by forests. For instance, temperature limits tree growth in high-altitude treelines, and changes in temperature and carbon dioxide (CO2) uptake can significantly alter growth patterns.
Pinus roxburghii, a key species in the subtropical Western Himalayas, plays a critical role in ecosystem restoration and sustainable forestry practices due to its adaptability and resilience . Understanding the height-diameter relationship of this species is essential for optimizing forest management strategies, enhancing growth and yield predictions, and supporting biodiversity conservation and carbon sequestration efforts .
Nepal comprises nearly 45% of its land mass as forest, including other woodlands, with about one-third of the total forest area handed over to over 30,000 forest user groups. The community forestry program in Nepal is considered highly successful in nature conservation, resulting in a substantial increase in forest area in the middle and high mountains of Nepal . However, the technical aspects of forest management in Nepal are poorly understood due to the lack of scientific studies on the growth performance of forest trees, forest health, and harvesting modalities in the context of changing climate and human interference.
Our study aims to establish a baseline model for Pinus roxburghii, which can serve as a starting point for more detailed studies. A generalized model provides a useful reference that can be refined as more site-specific data becomes available. Despite the assumption of uniform site conditions, our model has practical applications in forest management and conservation planning, providing a valuable tool for decision-makers in the absence of detailed site data.
2. Methodology
2.1. Study Area
The research was conducted throughout the country, Nepal where plot set by Forest Research and Training Centre (FRTC) permanently for Pinus roxburghii were used. Pinus roxburghii (chir pine) is one of the most common conifers in the sub-tropical region of Nepal and is distributed in all aspects of Western Himalaya but is generally found in well-exposed southern slopes in Central and Eastern Nepal. It can grow reasonably well in almost all types of soil and has been proved to be a successful pioneer even at most degraded site due to its high survival rate.
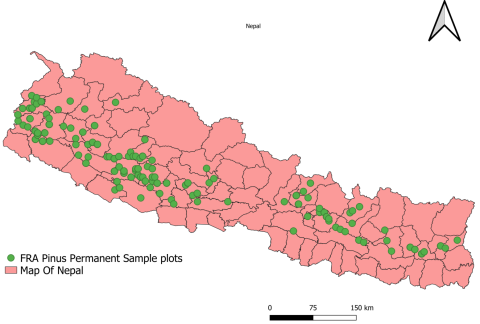
Figure 1. Study Area Map.
2.2. Data Collection
Sampling Design
Data was obtained from Forest Resource Assessment (FRA), 2018 undertaken by Forest Research and Training Centre (then Department of Forest Research and Survey). Stratified systematic cluster sampling design has been used in FRA throughout the country. Stratification is the process of grouping of the population into relatively homogeneous sub-groups before sampling . Cluster is the group of sample plots and it is used when the population can be divided to separate groups.
Furthermore, a two-phase cluster sampling method has been applied in FRA. At the first- phase, a grid of 4 km by 4 km has been established, and at each grid point/knot a cluster of plots has been set up. At the second phase, a sub-sample of the clusters has been drawn for field measurements. At each grid point, a cluster of plots has been established. Each cluster consists of four sample plots in Terai where 300 m apart in both north-south and west-east direction. And six sample plots in Chure spaced 150 m apart in the north-south direction and 300 m apart in the west-east direction. The reason for the difference sampling design in the Terai region was due to the low variability in forest resources in this region, because elevation does not cause changes in the ecotypes. In the second phase, a sub-sample of the cluster was drawn for the field measurement. A total of 664 plots are measured in forest land, the clusters were systematically numbered from south to north and west to east throughout the country. In the case of inventories of natural forests, where trees with respect to wide variety of size, age and species are present, Concentric Circular Sample Plots (CCSPs) was used for tallying trees . The CCSP to be applied in the FRA consists of four circular plots. The largest plot, with a radius of 20 meters (r1) covering an area of 1256.6 square meters, focuses on measuring all large-size trees with a diameter at breast height (DBH) equal to or greater than 30 centimeters. The plot with a radius of 15 meters (r2) and an area of 706.9 square meters targets trees with DBH ranging from 20 to less than 30 centimeters. Following this, the third largest plot, with a radius of 8 meters (r3) encompassing 201.1 square meters, is dedicated to measuring trees with DBH from 10 to less than 20 centimeters. Lastly, the smallest plot, with a radius of 4 meters (r4) covering an area of 50.3 square meters, focuses on trees with DBH from 5 to less than 10 centimeters.
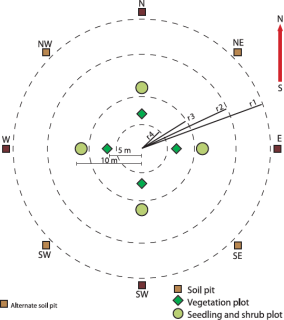
Figure 2. Concentric Circular Sample Plot (Source: ).
The diameters at breast height of all the trees and the heights of the sampled trees were measured. The diameter was measured with a diameter tape at 1.3 m height above the ground level and total height with a Vertex IV and Transponder. Both variables (diameter and height) were measured according to diameter class. Diameter class was identified from (0-10, 10-20, 20-30, 30-40, 40-50, >50) . Distorted, damaged, dead, and curved stems were excluded.
2.3. Data Analysis
Data was utilized from Forest Resource Assessment, Nepal, 2018 data base. A total of 664 unique sample plots were found in the study area i.e., throughout Nepal. Data was cleansed with the help of MS-Excel. Outliers were identified by calculating inter-quartile range. Finally, the total of 610 sample plots were remnant of the original dataset.
2.4. Model Formulation
Different forms of equation were fitted to find out the best fitted model (Table 1). We implemented a split sample approach where, the whole data was split into train data set (80%) for fitting of model and test data set (20%) for the model validation . But The model was fitted with height as dependent variable and diameter at breast height (dbh) as independent variable.
Table 1. Different types of candidate model.

Model form

Model

Equation

Simple linear

M1

Y= ax +b

Polynomial degree 2

M2

Y= a x2+bx+ c

Polynomial degree 3

M3

Y= ax3+bx2+ dx+c

Logarithmic

M4

Y= a * log(x) + c

Inverse

M5

Y= f(x)

Source:
2.5. Model Evaluation
R software, its utilities and packages were used to determine the fit statistics and parameters for each model. Model parameters were estimated using lm and nls functions in R. Model performance was based on numeric analysis of the following: (1) Root Mean Square Error (RMSE), (2) Adjusted R2, and (3) Akaike Information Criteria (AIC) . Model performance criteria were calculated in R which is also described by following formulae:
RMSE=1n-p-1i-1n(Yi - Ŷi)
Where Yi and Ŷ are the observed and predicted values for the dominant height of the observation i, respectively; n is the total non-missing observations used to fit the model; and p is the number of parameters in the model.
adj.R2=1-(- 1)i=1n(Yi - Ŷi)2 (- p)i=1n(Yi - Ŷi)2
Where n is number of observations, Ŷ is the mean of observed height and other symbols are same as above.
AIC=n×ln(RSS/n)+2K
Where RSS is residual sum of square and k is number of parameters involved.
Where all symbols are as above.
Table 2. Criteria for validating candidate model.

Criterion

Equation

Ideal Result

AIC

AIC = n ×ln (RSS/n) + 2K

Smaller AIC value

Adjusted R2

adj.R2 = 1 - (- 1)i=1n(Yi - Ŷi)2 (- p)i=1n(Yi - Ŷi)2

Higher adj. R², ideal value is 1

RMSE

RMSE= 1n-p-1i-1n(Yi - Ŷi)

Smaller RMSE value; ideal value is 0

Source:
2.6. Model Validation
The test data set (20%) was used for model validation. The test data of the best-selected model was used to analyze its overall model performance. Residuals graphs (histograms, Q-Q plots) and plot of fitted line overlaid on the observed heights data were produced for visual interpretation . We compared FRA models and best selected model by using same dependent variable (diameter) of the data. Firstly, normality test (Shapiro wilk test) which determined to use either parametric or non-parametric test. In Shapiro test p value determined either our predicted heights and previously predicted heights are normally distributed or not normally distributed P value determined either variance are equal or unequal by Levene's Test for Homogeneity of Variance. Variance test was just a test that did not determined the further statistical test. P value of Shapiro wilk test determined either to use Parametric or non-parametric test. Non parametric test, Wilcoxon. test by setting hypothesis (1.H0 <- "There is no significant difference between the heights predicted by two models" 2. H1 <- "Heights Predicted by two models differ significantly") was used. P value determined that there is no significant difference between the heights predicted by two models. So Wilcoxon. Test used for validation of the best model with FRA models.
3. Result
3.1. Statistical Summary of DBH and Height
Descriptive summary of dbh and height was determined in R. Mean, median, quartile of dbh and height was calculated. Their descriptive summary is as given;
Table 3. Statistical summary of DBH and Height.

DBH Class

No. of trees

Statistics

Diameter

Height

0-10

19

1st Q

6.300

3.650

3rd Q

8.100

4.850

Mean

7.326

4.579

Median

7.200

4.000

10-20

88

1st Q

11.15

6.650

3rd Q

15.70

11.650

Mean

13.47

9.328

Median

12.80

9.000

20-30

208

1st Q

22.00

12.5

3rd Q

26.70

17.8

Mean

24.53

15.2

Median

24.50

15.5

30-40

175

1st Q

32.20

16.80

3rd Q

36.85

22.90

Mean

34.47

20.38

Median

34.20

20.20

40-50

75

1st Q

42.33

20.88

3rd Q

46.50

27.38

Mean

44.45

24.41

Median

44.25

24.30

>50

45

1st

54.23

26.62

3rd Q

66.60

35.40

Mean

61.30

31.26

Median

60.15

29.85

Correlation between Diameter and height
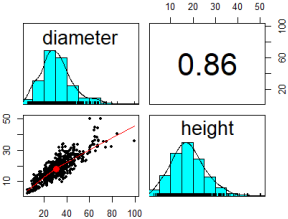
Figure 3. Correlation between diameter at breast height (DBH) and Height.
The correlation between DBH and height was found to be r= 0.86 which showed positive and significant relationship.
3.2. Model Formulation and Evaluation
Different forms of equation were fitted to find out the best fitted model (Table 1). We implemented a split sample approach where the whole data was split into train data set (80%) for fitting of model and test data set (20%) for the model validation . The model was fitted with height as dependent variable and diameter at breast height (dbh) as independent variable. The equations generated for each model presented as in table 5.
Model parameters were estimated using lm and nls functions in R. Parameter estimates of candidate models are as presented in (Table 5).
Nearly all models showed significant parameter estimates (p<0.05) except for polynomial model degree 3. Therefore, performance criteria values were considered to assess the model’s performance. All models were evaluated against multiple model performance criteria.
Table 4. Different models with final equations.

Model Form

Model

Formula

Simple Linear

M1

height = 0.466 *dbh + 3.623

Polynomial (2)

M2

height=1.1052804+0.6252304*dbh−0.0021242*dbh2

Polynomial (3)

M3

height=1.569+0.5791*dbh−0.0008634⋅*dbh2−0.000009678* dbh3

Logarithmic

M4

log(height) = -0.075 + 0.862 * log(dbh)

Inverse

M5

height= 27.261 + -227 * (1/dbh)

Table 5. Parameter estimates of different model.

Model

Coefficients/Parameters

Estimates

Std error

t-value

p-value

M1

intercept

3.6231

0.4557

7.95

1.31e-14

diameter

0.4657

0.0134

34.74

< 2e-16

M2

Intercept

1.1052804

0.8007517

1.38

0.168129

poly (diameter, degree = 2)1

0.6252304

0.0440294

14.20

< 2e-16

poly (diameter, degree = 2)2

-0.0021242

0.0005591

-3.80

0.000163

M3

(Intercept)

1.569

1.28

1.226

0.221

poly (diameter, degree = 3)1

0.5791

0.1086

5.331

1.5e-07

poly (diameter, degree = 3)2

−0.0008634

0.002769.

-0.312

0.755

poly (diameter, degree = 3)3

−0.000009678

0.00002082

-0.465

0.642

M4

(Intercept)

-0.07519

0.07566

-0.994

0.321

Log (diameter)

0.86165

0.02244

38.398

<2e-16

M5

(Intercept)

27.2610

0.4688

58.15

<2e-16

I(1/diameter)

-227.2172

10.0655

-22.57

<2e-16

Table 6. Performance statistics of different models.

Model

Intercept

a

b

d

Adj. R2

RMSE

AIC

M1

3.578

0.466

N/A

N/A

0.712

3.718

2747.567

M2

18.168

-15.08

139.782

N/A

0.720

3.639

2735.253

M3

18.168

-1.847

-15.08

139.782

0.720

3.642

2737.035

M4

-0.075

0.862

N/A

N/A

0.75

3.695

2703.218

M5

27.365

N/A

N/A

N/A

0.511

5.731

3006.688

Lower AIC value, lower RMSE and higher adjusted R2 was observed and ranked for best model selection. We ranked models based on performance criteria as shown in the table below:
Table 7. Ranking of the model.

Model

Fitting Rank

RMSE

AIC

Total

Rank

Adj. R2

M1

3

4

4

11

6

M2

2

1

2

5

1

M3

2

2

3

7

4

M4

1

3

1

5

2

M5

4

5

5

14

7

The polynomial degree 2 and logarithmic i.e., model 2 and model 4 performed best across various performance criteria. But polynomial degree 2 is the simplest model than logarithmic, so this study suggested M2 for predicting height.
The validation data was used in the best-selected model to analyze the model performance. The fitted data was then overlaid in observed data using ggplot2 package in R which is as shown below:
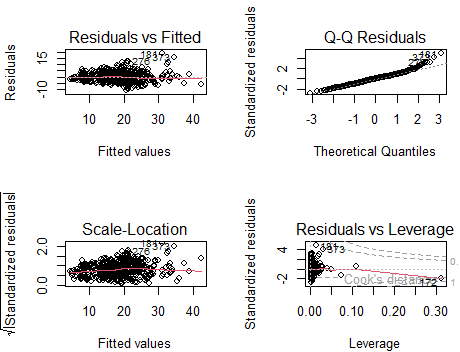
Figure 4. Scatter plots of standardized residuals versus fitted values and normal probability plots of standardized residuals.
The upper right panel shows the QQ-plot of the standardized residuals. If all points are approximately on a straight line, then normality of the residuals can be assumed . Red line in graph indicates that the closer to zero, better validity for 2nd order polynomials.
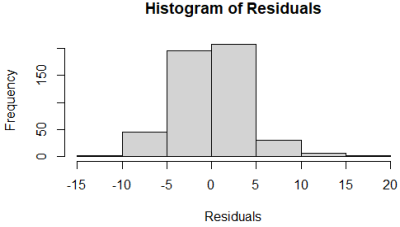
Figure 5. Histogram of residual for second order polynomial.
The normality of the polynomial degree 2 model was interpreted using residual graphs (in histogram) bell shaped indicating the normality of the model.
3.3. Comparison of Height Predicted by M2 and FRA Models
After selecting polynomial degree 2 as the best `we compared the height predicted by M2 model and FRA models as:
previous models were:
chure: h(d) = 1.3 + 108.5695 * diameter/(157.1189 + diameter)
Mid_hill: h(d)=1.3+d2/(8.351 + 1.158 *diameter + 0.014* diameter2)
HHMH: h(d)=1.3+d2/(6.31 + 1.754 *diameter + 0.0047* diameter2)
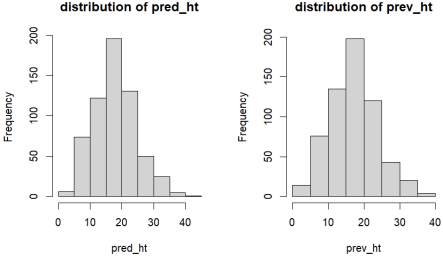
Figure 6. Histogram (Distribution of previous height and predicted height by using best resulted model)).
We compared FRA models and best selected model by using same dependent variable (diameter) of the data. Firstly, normality test (Shapiro wilk test) which determined to use either parametric or non-parametric test. In Shapiro test p value =3.206751e-06<0.05 was found. P value =0.8454794> 0.05 determined variance are equal by Levene's Test for Homogeneity of Variance. So non parametric test (Wilcoxon. test) P value= 0.06522745 >0.05 was found. This hinted that there is no significant difference between the heights predicted by FRA models and best resulted model. So, Wilcoxon. test used for validation of the best model with FRA models.
4. Discussion
In this study, the precision of diverse methodologies in estimating tree height utilizing diameter at breast height (DBH) as an independent variable was explored, aiming to distinguish the most dependable height prediction models for Pinus roxburghii. The analysis revealed a robust positive and statistically significant relationship between DBH and height, with a correlation coefficient of 0.86, underscoring the reliability of DBH as a predictor for tree height in this particular species. To assess various statistical model categories, comprising polynomial, logarithmic, inverse, and linear models, a sequence of statistical analyses were performed utilizing R software, incorporating functions like lm for linear models and nls for non-linear models. The evaluation of the models encompassed several criteria like coefficient of determination (R²), root mean squared error (RMSE), and Akaike Information Criterion (AIC). Models exhibiting higher R² values, lower RMSE, and AIC values signify enhanced model performance by elucidating a larger portion of the height variance, indicating reduced disparities between observed and projected values, and accounting for both model adequacy and intricacy .
Among the models tested, the linear model (referred to as M1) illustrated superior efficacy in height prediction based on DBH. This outcome aligns with previous research indicating the effectiveness of linear models in capturing the height-diameter allometry of evenly aged stands . Furthermore, a polynomial model of second degree emerged as a strong model for height estimation. Despite second-degree polynomial models being a subtype of linear models, they offer the benefit of capturing subtle curvatures in the height-diameter relationship, thereby enhancing predictions for specific forest stand configurations.
The height-diameter correlation undergoes alterations as individual trees mature, with initial rapid height ascension until the midpoint growth stage, followed by a deceleration in height growth and a pronounced increase in diameter growth. These dynamics imply that various tree development phases can be suitably represented utilizing linear or non-linear functions. Although the linear model was deemed optimal for this inquiry, the second-degree polynomial model presents a pragmatic approach for capturing these growth trends, especially when considering the intricate nature of forest stand dynamics.
In order to validate the chosen model, a comparison was made against three height prediction models recommended by the Forest Resource Assessment in 2010, utilizing the same dependent variable, DBH, throughout the dataset. The assessment of normality in the projected height distributions was conducted through the Shapiro-Wilk test, yielding a p-value of 3.206751×10⁻⁶<0.05, indicating a non-normal distribution of the predicted heights and highlighting the necessity for non-parametric tests. Levene's Test was employed to examine the equality of variances among the predicted height distributions, with a p-value of 0.8454794 (> 0.05) indicating homogeneous variance across groups.
The utilization of the Wilcoxon Signed-Rank Test was necessary due to the non-normal distribution of the data, in order to conduct a comparison of the models. Within the framework of this test, the null hypothesis (H₀) stated that there is no statistically significant distinction between the heights projected by the two models, while the alternative hypothesis (H₁) suggested a notable difference in the heights projected by the models. The outcomes of the test revealed a p-value of 0.06522745 (> 0.05), signifying the absence of a significant distinction in the heights projected by our superior model and the FRA models. This discovery serves to authenticate the dependability of our proposed model and advocates for its adoption as a pragmatic instrument for forest management and planning.
The implications of this study hold significant for height estimation for Pinus roxburghii in Nepal. Despite the straightforward nature of the linear model, the polynomial degree 2 model provides a harmonious balance between precision and computational simplicity, thereby establishing itself as a sturdy tool for forest managers and researchers. In contradistinction to the methodology proposed by the FRA, which recommends distinct models for different regions, our research promotes the utilization of a singular polynomial degree 2 model for nationwide implementation. This simplification serves to reduce complexity and enhances the utility of height projections across a spectrum of ecological zones, thereby facilitating efficient forest inventory and monitoring efforts across the diverse landscapes of Nepal. Collectively, this study contributes to the formulation of a dependable and universally adaptable model for the estimation of tree height based on DBH, consequently supporting sustainable forest management practices.
5. Conclusion
In this Study Polynomial degree 2 form of equation is best fit compared to the linear, logarithmic, inverse, polynomial degree 3. FRA suggested three models for different regions in 2010 but we can conclude that there is no significant difference between predicting height by three different models and the model suggested in our study i.e. polynomial degree 2. Since we considered diameter as the only predictor variable, caution should be applied while using our model to other forests stands that differ in site and stand conditions. In future research, our model can be extended to other regions and management regimes (e.g., tree outside forestry), following updates through refitting and validation against independent data from the broadest possible ranges of size, site, and stand conditions, including stand and plot attributes across the distributional ranges of P.roxburghii.
Abbreviations

adj.R2

Adjusted Coefficient of Determination

AIC

Akaike Information Criterion

CCSPs

Concentric Circular Sample Plots

CO2

Carbon Dioxide

DBH

Diameter at Breast Height

FRA

Forest Resource Assessment

FRTC

Forest Research and Training Centre

RMSE

Root Mean Square Error

Author Contributions
Jharana Upadhyay: Conceptualization, Data curation, Formal Analysis, Methodology, Resources, Writing – original draft
Shiva Khadka: Data curation, Validation, Writing – original draft, Writing – review & editing
Conflicts of Interest
The authors declare no conflicts of interest.
References
[1] Arabatzis, A. A., & Burkhart, H. E. (1992). An evaluation of sampling methods and model forms for estimating height-diameter relationships in loblolly pine plantations. Forest science, 38(1), 192-198.
[2] Calama, R., & Montero, G. (2004). Interregional nonlinear height diameter model with random coefficients for stone pine in Spain. Canadian Journal of Forest Research, 34(1), 150-163.
[3] Curtis, R. O. (1967). Height-diameter and height-diameter-age equations for second-growth Douglas-fir. Forest science, 13(4), 365-375.
[4] DFRS. State of Nepal’s Forests. Department of Forest Resource and Survey.: Kathmandu; 2015.
[5] Du, R. Y. (2010). Univariate Techniques. Wiley International Encyclopedia of Marketing, 2007.
[6] Fang, Z., & Bailey, R. L. (1998). Height–diameter models for tropical forests on Hainan Island in southern China. Forest ecology and management, 110(1-3), 315-327.
[7] FRTC, 2022 Field Manual, 2022 (Remeasurement of Permanent Sample Plot), Forest Resource Assessment (FRA), Forest Reserch & Training Center (FRTC), Nepal.
[8] Gaire, N. P., Bhuju, D. R., Koirala, M., Shah, S. K., Carrer, M., & Timilsena, R. (2017). Tree-ring based spring precipitation reconstruction in western Nepal Himalaya since AD 1840. Dendrochronologia, 42, 21-30.
[9] Harsch, M. A., Hulme, P. E., McGlone, M. S., & Duncan, R. P. (2009). Are treelines advancing? A global meta-analysis of treeline response to climate warming. Ecology letters, 12(10), 1040-1049.
[10] Holtmeier, F. K., & Broll, G. E. (2007). Treeline advance-driving processes and adverse factors. Landscape online, 1-1.
[11] Huang, S., Titus, S. J., & Wiens, D. P. (1992). Comparison of nonlinear height–diameter functions for major Alberta tree species. Canadian Journal of Forest Research, 22(9), 1297-1304.
[12] Intergovernmental Panel on Climate Change (IPCC) (2007), Climate Change 2007: The Scientific Basis. Contribution of Working Group I to the Fourth Assessment Report of the Intergovernmental Panel on Climate Change, edited by S. Solomon et al., Cambridge Univ. Press, New York.
[13] IPCC. Summary for policymakers. In Climate Change 2014: Impacts, Adaptation, and Vulnerability. Part A: Global and Sectoral Aspects. Contribution of Working Group II to Fifth Assessment Report of the Intergovernmental Panel on Climate Change (eds) FieldCB, BarrosVR, Dokken DJ, Mach KJ, Mastrandrea MD, Bilir TE, Chatterjee M, Ebi KL, Estrada YO, Genova RC, Girma B, Kissal ES, Levy AN, MacCracken S, Mastrandrea PR, White LL. Cambridge University Press, Cambridge, and New York. 2014: 1-32.
[14] Jeelani, M. I., Tabassum, A., Rather, K., & Gul, M. (2023). Neural Network Modeling of Height Diameter Relationships for Himalayan Pine through Back Propagation Approach. Journal of The Indian Society of Agricultural Statistics, 76(3), 169-178.
[15] Joshi, K., Sehgal, S., Gupta, M., Upadhyay, L., & Shrivastava, V. (2022). Carbon Stock of Pinus roxburghii Sarg. in Siwalik Foot Hills of Jammu Carbon Stock of Pinus roxburghii Sarg. in Siwalik Foot Hills of Jammu. September.
[16] Koirala, A., Kizha, A. R., & Baral, S. (2017). Modeling Height-Diameter Relationship and Volume of Teak (Tectona grandis L. F.) in Central Lowlands of Nepal. Journal of Tropical Forestry and Environment, 7(1), 28–42.
[17] Lama, Y. C., Ghimire, S. K., & Aumeeruddy-Thomas, Y. (2001). Medicinal plants of Dolpo. Amchis’ knowledge and conservation. WWF Nepal Program, Katmandu.
[18] Lynch, T. B., & Murphy, P. A. (1995). A compatible height prediction and projection system for individual trees in natural, even-aged shortleaf pine stands. Forest Science, 41(1), 194-209.
[19] Mehtätalo, L., de-Miguel, S., & Gregoire, T. G. (2015). Modeling height-diameter curves for prediction. Canadian Journal of Forest Research, 45(7), 826-837.
[20] Muhammad S. A. (2012). The position of Pinus roxburghii in the forests of Kotli hills, Azad Jammu and Kashmir. African Journal of Plant Science, 6(3), 106–112.
[21] Newton, P. F., & Amponsah, I. G. (2007). Comparative evaluation of five height–diameter models developed for black spruce and jack pine stand-types in terms of goodness-of-fit, lack-of-fit and predictive ability. Forest Ecology and Management, 247(1-3), 149-166.
[22] Sapkota, P., & Meilby, H. (2009). Modelling the growth of Shorea robusta using growth ring measurements. Banko Janakari, 19(2), 25-32.
[23] Sharma, E. R. and Pukkala, T. 1990. Volume Equations and Biomass Prediction of Forest Trees of Nepal. Publication no 47, Forest Survey and Statistics Division, Ministry of Forests and Soil Conservation, Kathmandu, Nepal.
[24] Sharma, M., & Parton, J. (2007). Height–diameter equations for boreal tree species in Ontario using a mixed-effects modeling approach. Forest Ecology and Management, 249(3), 187-198.
[25] Sharma, M., & Yin Zhang, S. (2004). Height–diameter models using stand characteristics for Pinus banksiana and Picea mariana. Scandinavian Journal of Forest Research, 19(5), 442-451.
[26] Sharma, R. P. (2009). Modelling height-diameter relationship for Chir pine trees. Banko Janakari, 19(2), 3-9.
[27] Shrestha, A. B., Bajracharya, S. R., Sharma, A. R., Duo, C., & Kulkarni, A. (2017). Observed trends and changes in daily temperature and precipitation extremes over the Koshi river basin 1975–2010. International Journal of Climatology, 37(2), 1066-1083.
[28] Shrestha, A. B., Wake, C. P., Dibb, J. E., & Mayewski, P. A. (2000). Precipitation fluctuations in the Nepal Himalaya and its vicinity and relationship with some large scale climatological parameters. International Journal of Climatology: A Journal of the Royal Meteorological Society, 20(3), 317-327.
[29] Shrestha, A. B., Wake, C. P., Mayewski, P. A., & Dibb, J. E. (1999). Maximum temperature trends in the Himalaya and its vicinity: an analysis based on temperature records from Nepal for the period 1971–94. Journal of climate, 12(9), 2775-2786.
[30] Subedi, M. R., Oli, B. N., Shrestha, S., & Chhin, S. (2018). Height-Diameter Modeling of Cinnamomum tamala Grown in Natural Forest in Mid-Hill of Nepal. International Journal of Forestry Research, 2018.
[31] THORNLEY, J. H. (1999). Modelling stem height and diameter growth in plants. Annals of Botany, 84(2), 195-205.
[32] Trincado, G., & Burkhart, H. E. (2006). A generalized approach for modeling and localizing stem profile curves. Forest Science, 52(6), 670-682.
[33] Wagle, B. H., & Sharma, R. P. (2012). Modelling individual tree basal area growth of Blue pine (Pinus wallichiana) for Mustang district in Nepal. Forest Science and Technology, 8(1), 21-27.
[34] Zeide, B. (1993). Analysis of growth equations. Forest science, 39(3), 594-616.
Cite This Article
  • APA Style

    Upadhyay, J., Khadka, S. (2024). Modelling Height-Diameter Relationship of Pinus Roxburghii in Nepal. American Journal of Biological and Environmental Statistics, 10(3), 49-59. https://doi.org/10.11648/j.ajbes.20241003.12

    Copy | Download

    ACS Style

    Upadhyay, J.; Khadka, S. Modelling Height-Diameter Relationship of Pinus Roxburghii in Nepal. Am. J. Biol. Environ. Stat. 2024, 10(3), 49-59. doi: 10.11648/j.ajbes.20241003.12

    Copy | Download

    AMA Style

    Upadhyay J, Khadka S. Modelling Height-Diameter Relationship of Pinus Roxburghii in Nepal. Am J Biol Environ Stat. 2024;10(3):49-59. doi: 10.11648/j.ajbes.20241003.12

    Copy | Download

  • @article{10.11648/j.ajbes.20241003.12,
      author = {Jharana Upadhyay and Shiva Khadka},
      title = {Modelling Height-Diameter Relationship of Pinus Roxburghii in Nepal
    },
      journal = {American Journal of Biological and Environmental Statistics},
      volume = {10},
      number = {3},
      pages = {49-59},
      doi = {10.11648/j.ajbes.20241003.12},
      url = {https://doi.org/10.11648/j.ajbes.20241003.12},
      eprint = {https://article.sciencepublishinggroup.com/pdf/10.11648.j.ajbes.20241003.12},
      abstract = {Height and diameter are two factors that are considered when developing (volume and yield) tables, as well as for determining site quality and site index. Diameter is easily measured using precise and affordable instruments. However, height measurement is complex in terms of time, skill, and resource. So, developing allometric equation of height-diameter is useful to predict height from diameter to calculate tree volume, biomass, and carbon storage and survival analysis. The study was carried out in Nepal. The study area comprised of a total of 664 unique plots of Pinus roxburghii. Data was obtained from Forest Resource Assessment, 2018 undertaken by Forest Research and Training Centre (then Department of Forest Research and survey). Diameter was measured with a diameter tape at 1.3 m height above the ground level and total height was measured with a Vertex IV and Transponder. A two-phase cluster sampling was applied during data collection. Statistical software R and MS-Excel were used for data analysis. Correlation analysis showed significant positive correlation (r = 0.86) between DBH (diameter at breast height) and Height. The relationship between height as dependent variable to diameter was established through regression analysis, different suggested models were tested accordingly. Different forms of candidate models including linear, polynomial, logarithmic, and inverse were fitted to select the best height prediction model. The Akaike Information Criterion (AIC), Root Mean Square Error (RMSE), and Adjusted Coefficient of Determination (R2 adj.) were used to evaluate the model. Polynomial degree 2 form of equation (height=1.1052804+0.6252304*dbh−0.0021242*dbh2) resulted as the best model with values of adj. R2 RMSE, and AIC; 0.720, 3.639 and 2735.253 respectively.
    },
     year = {2024}
    }
    

    Copy | Download

  • TY  - JOUR
    T1  - Modelling Height-Diameter Relationship of Pinus Roxburghii in Nepal
    
    AU  - Jharana Upadhyay
    AU  - Shiva Khadka
    Y1  - 2024/09/20
    PY  - 2024
    N1  - https://doi.org/10.11648/j.ajbes.20241003.12
    DO  - 10.11648/j.ajbes.20241003.12
    T2  - American Journal of Biological and Environmental Statistics
    JF  - American Journal of Biological and Environmental Statistics
    JO  - American Journal of Biological and Environmental Statistics
    SP  - 49
    EP  - 59
    PB  - Science Publishing Group
    SN  - 2471-979X
    UR  - https://doi.org/10.11648/j.ajbes.20241003.12
    AB  - Height and diameter are two factors that are considered when developing (volume and yield) tables, as well as for determining site quality and site index. Diameter is easily measured using precise and affordable instruments. However, height measurement is complex in terms of time, skill, and resource. So, developing allometric equation of height-diameter is useful to predict height from diameter to calculate tree volume, biomass, and carbon storage and survival analysis. The study was carried out in Nepal. The study area comprised of a total of 664 unique plots of Pinus roxburghii. Data was obtained from Forest Resource Assessment, 2018 undertaken by Forest Research and Training Centre (then Department of Forest Research and survey). Diameter was measured with a diameter tape at 1.3 m height above the ground level and total height was measured with a Vertex IV and Transponder. A two-phase cluster sampling was applied during data collection. Statistical software R and MS-Excel were used for data analysis. Correlation analysis showed significant positive correlation (r = 0.86) between DBH (diameter at breast height) and Height. The relationship between height as dependent variable to diameter was established through regression analysis, different suggested models were tested accordingly. Different forms of candidate models including linear, polynomial, logarithmic, and inverse were fitted to select the best height prediction model. The Akaike Information Criterion (AIC), Root Mean Square Error (RMSE), and Adjusted Coefficient of Determination (R2 adj.) were used to evaluate the model. Polynomial degree 2 form of equation (height=1.1052804+0.6252304*dbh−0.0021242*dbh2) resulted as the best model with values of adj. R2 RMSE, and AIC; 0.720, 3.639 and 2735.253 respectively.
    
    VL  - 10
    IS  - 3
    ER  - 

    Copy | Download

Author Information
  • Faculty of Forestry, Agriculture and Forestry University, Hetauda, Nepal

    Research Fields: Forest Biometric, Wildlife, GIS, Remote Sensing, Forest Utilization, Forest Management

  • Institute of Forestry, Tribhuvan University, Hetauda, Nepal

    Research Fields: Forest management, Climate Change and Environmental justice, Urban Forestry, Ecology, GIS and Remote Sensing, Wildlife

  • Abstract
  • Keywords
  • Document Sections

    1. 1. Introduction
    2. 2. Methodology
    3. 3. Result
    4. 4. Discussion
    5. 5. Conclusion
    Show Full Outline
  • Abbreviations
  • Author Contributions
  • Conflicts of Interest
  • References
  • Cite This Article
  • Author Information